|
|
Summary
How do the WebSites of the Top 10 Companies of the Fortune 500
compare in terms of Best Online Experience?
Goals
For this comparative analysis of websites
we define two important dimensions that allow us to
rank order each website in terms of Best Online Experience:
We used the eValid website analysis engine, programmed (see below) to collect specific metrics that contribute to these factors. To assure accuracy the measurements were done over a short time frame and using identical access capabilities.
Results
The measurements we made of the webstes of the Top 10
Fortune 500 Companies
produced the relative Best Online Experience comparison chart shown.
The data shown are normalized relative values.
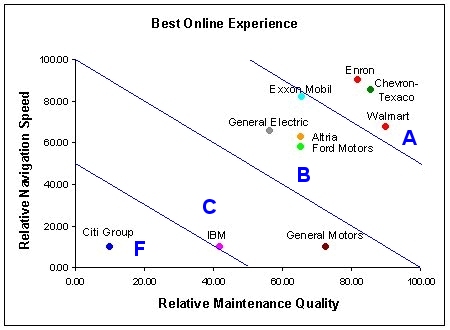
The best-performing WebSites are in the upper right of the chart, and the worst-performing WebSites are in the lower left of the chart.
Individual Summary Results
The table below shows all of the results used to construct
the comparative chart.
Click to see the eValid Summary Report with the raw data.
Click to see the 3D-SiteMap for each WebSite.
Here are Animations and
Usage Instructions for the 3D-SiteMaps.
Right-click anywhere on any 3D-SiteMap for documentation.
Here are some
Usage Hints if you want to dig deeper in the 3D-SiteMaps.
| # | Company | Click For Summary Report | Comments | Click For SiteMap | Comments |
| 1 | Altria ($73B) www.altria.com | eValid Report | B: A very large WebSite which also exceeded the depth-3 5000 link limit. |

| A+: The WebSite structure is normal, with no reverse edges, no broken links near the top of the site. |
| 2 | ChevronTexaco ($100B) www.chevrontexaco.com | eValid Report | A+: This a very large WebSite implemented with dynamic page generation and an oops page to prevent broken links. |
| B+: Good basic organization, a few reverse links, none broken in the top layers. |
| 3 | Citigroup ($112B) www.citigroup.com | eValid Report | C-: This WebSite appears to be relatively stable (nearly half of the pages are old) and the informational aspects appear to be stable. |
| A-: Classic WebSite hierarchy, a few broken links. |
| 4 | Enron ($139B) www.enron.com | eValid Report | A: Very clean site, with few old pages, but sometimes bulky in content. |
| A-: Good spread from the top, a few broken links. |
| 5 | Exxon Mobil ($192B) www.exxonmobil.com | eValid Report | A+: Very large, mostly current, relatively quick WebSite. |
| B: Moderate complexity and depth, but too many choices in most cases. |
| 6 | Ford Motor ($162B) www.ford.com | eValid Report | B: Well organized WebSite, but plagued by slow loading pages. |
| A-: Good link fan out, a few 2nd layer broken links, not overly complex. |
| 7 | General Electric ($126B) www.ge.com | eValid Report | B: Relative large site but over 10% broken links in the top three layers, relatively stable. |
| B+: Clean structure, perhaps too heavy at the second layer, some broken links in top structure. |
| 8 | General Motors ($177B) www.gm.com | eValid Report | C+: A very clean WebSite, headed by a FLASH homepage, but with perhaps too many broken links. Very current, relatively quick, good link density. |
| A: Very good spread, limited complexity, some concentration points, nothing broken. |
| 9 | IBM ($86B) www.ibm.com | eValid Report | C: A large WebSite with a surprising number of broken links and slow-loading pages. |
| C-: Topmost layer shows disorganization with several broken and some backward links. |
| 10 | WalMart ($216B) www.walmart.com | eValid Report | A: A very large WebSite that is implemented with dynamic pages, it is one of the few where the 5000-link was exceeded. |
| A-: The structure is adequate, but complex. |
Methodology
To collect the data used in the chart we used the eValid WebSite
analysis engine with parameter settings as follows:
Web Access Details
All tests were done on a 384 Kbps (peak performance value) ADSL connection.
The data was collected with successive eValid runs
during normal business hours.