|
|
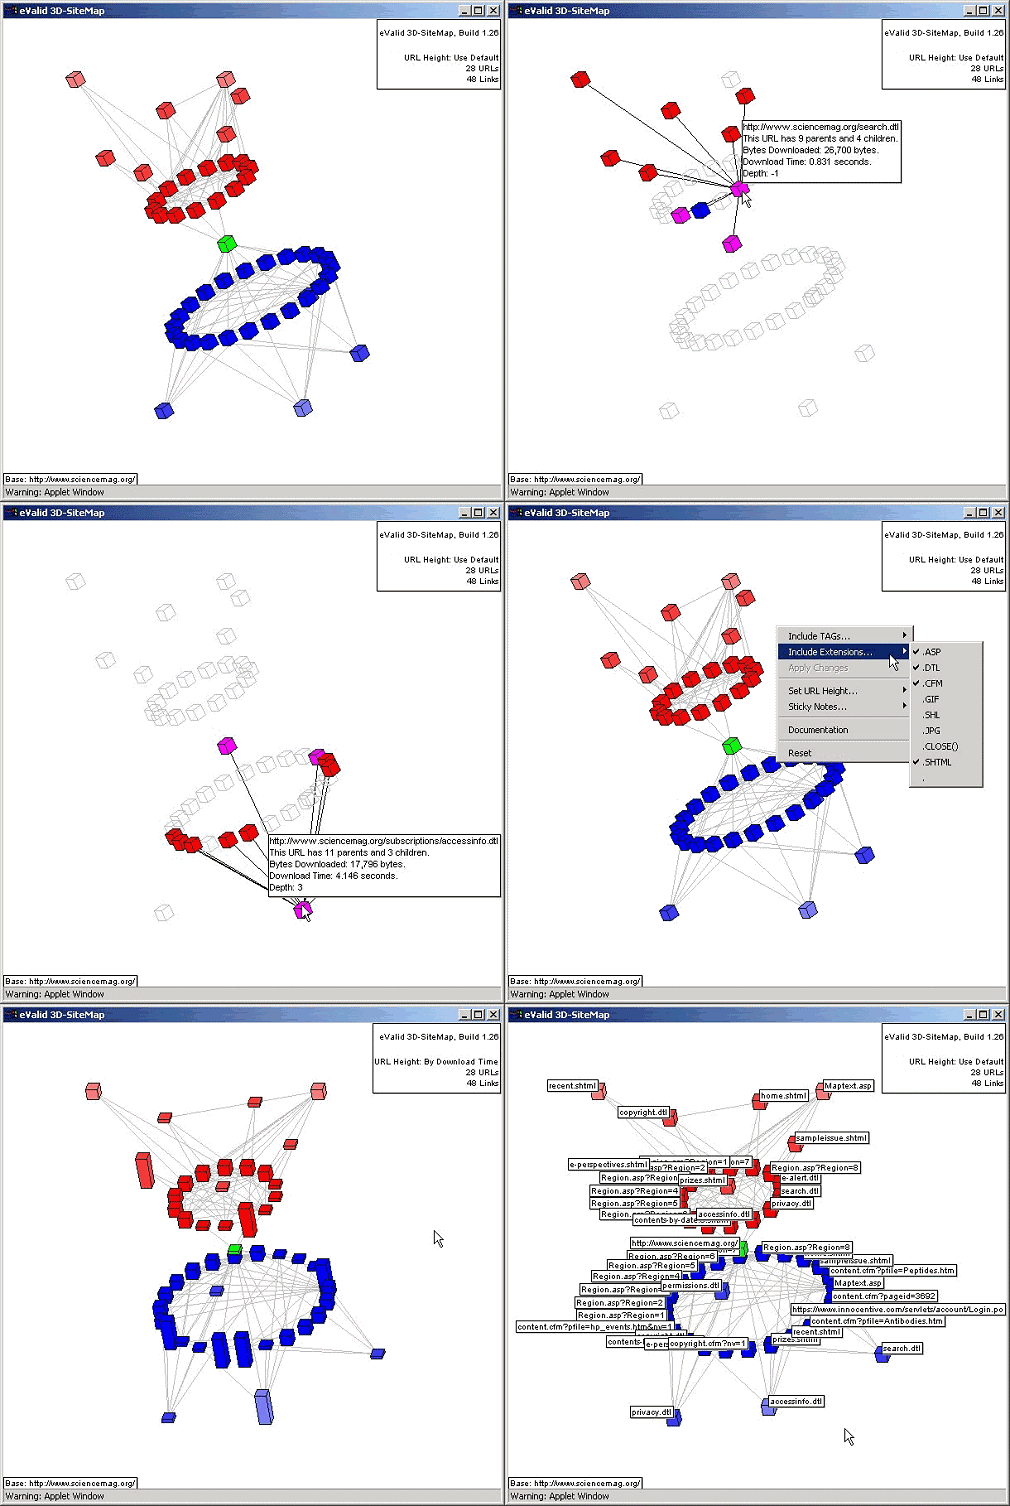
eValid's unique dynamic 3D-SiteMap examines your website's internal structure. The 3D-SiteMap display provides a unique way of viewing the results of an eValid Site Analysis run using eValid's website spider capability. 3D-SiteMap displays can be rotated in two axes, expanded, contracted, reconfigured, and annotated in a variety of ways.
|
Synopsis
eValid's 3D-SiteMap is a powerful visualization tool that displays dependency relationships accumulated by an eValid Site Analysis scan of your website. The 3D-SiteMap can be manipulated to show very great detail and multiple perspectives on how your website pages are organzed and how they perform. | ||||||||||||||
|
3D-SiteMap Generation Process
Each eValid site analysis run involves visiting a controlled subset of pages at/below a starting page on the website you are analyzing As the eValid spidering function examines each page at and below (dependent on) your starting page, it applies a set of quality filters to each page and as it is working it accumulates a complete set of parent/child dependencies. This data is stored internally and made available to the 3D-SiteMap program at the end of the analysis run.
Applications
Live Example
Here is the complete description of 3D-SiteMap options: 3D-SiteMap Summary and User Manual |
| |||||||||||||
Sample Screen [Animation]
Here is a sample 3D-SiteMap display, animated to show a few of
the various options available.

|
Display Manipulation Features
As suggested in the sample shown above, you can manipulate the 3D-SiteMap image in a variety of ways to illustrate and highlight important features.
|