|
|
Summary
eValid results from playbacks are placed in various files which can be viewed direct from the
eValid GUI and converted into a variety of formats.
General
All eValid script files, log files, and LoadTest logs are viewable from one of the pull down sequences:
Window > Script Window
Window > Logs > Event Log
Window > Logs > Performance Log
Window > Logs > Message/Error Log
Window > Logs > Timing Log
Window > Logs > LoadTest Log
Log File Contents
As eValid plays back a script it writes certain information about what
it is doing to four different log files: the Event Log, the Performance
Log, the Timing Log and the Message/Error Log.
As an eValid user you have several options in processing these files. Every file can be purged before playback, or can be appended to after each playback (if you have multiple playbacks).
Here's a summary of the differences in these log files:
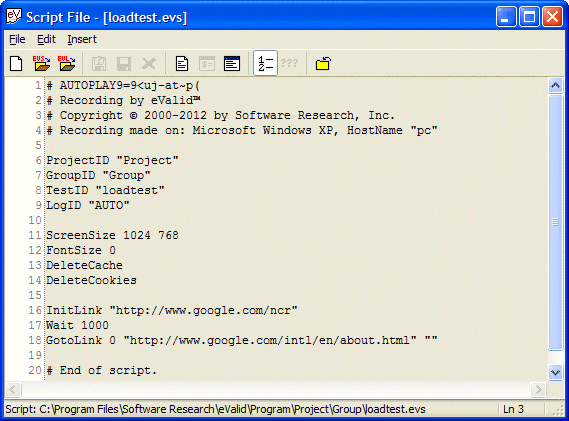
View Script File
The script file contains the current script being created by eValid or the script that eValid is
playing back.

Manually create a new script file using the pre-formatted template.
Open a regular playback script (*.evs).
Open a LoadTest script (*.evl).
Save the script using a new name.
Save (overwrite) the script using the current name.
Revert to the saved script (disregard all edits).
Edit the existing script [or create one from scratch].
Open script in the user defined Text Editor.
Edit the Data Synthesis File.
Toggle line numbers ON/OFF.
Close the script file, but not the window.
Toggles encryption/decryption of input data fields.
Double click on any script keyword and eValid will take you to the complete explanation for this keyword in the User Manual.
View Test Logs, LoadTest Log
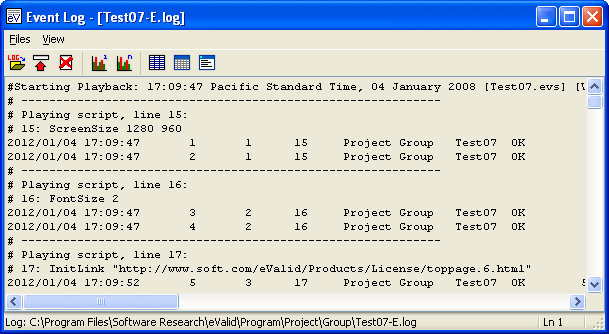
All four of the log files have the same format.
The Event Log is the complete record of a playback; the other three logs are subsets of the Event Log.
Access to information is the same for all four of these logs.
Here is a sample:

Open an existing log file.
Updates the current Record/Play Preferences to this filename.
Purge the contents of the log file.
Convert the log data into a spreadsheet.
Show a graphical chart for the data pertaining to the last test in the log.
Show a graphical chart for all data in the log.
This button converts the log file data into an HTML table.
This button views the log data in the defined text editor.