|
|
Summary
This page compares the results of simple HTTP requests with full-fidelity eValid page requests.
The differences are very important in reporting/interpreting eValid LoadTest results
compared with other non-browser based products.
Background
In load testing many products impose load on the web servers
using simulated or synthetic HTTP transactions.
On the other hand, eValid does NOT do this but, instead, applies loads that result from multiple copies of the eValid browser running in parallel on one or more computers.
The differences between the load imposed can be VERY significant, as the example below makes clear.
Example
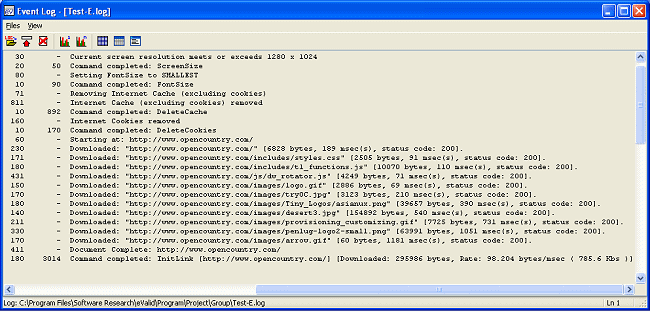
Here is a section of the eValid event log generated during page download playback
that shows the detailed times of each page component.
To get this level of data into the eValid event log we turned on detailed timing in eValid: Settings > Record/Play Preferences > Project/Log Management section > Log Output > Detail Level > Detailed.

Note from the data shown in this eValid event log fragment:
The reason this is slower than the rate for the entire page is that this measurement is of just one thread during the multi-threaded page download process. [This is reflected above when you note that total download time of all of the page components is greater than their unified download time taking into account the parallelism involved.]
Please note that a ratio of 10 : 1 means that the HTTP approach is effectively under-loading the server by that factor. This could lead to having a false sense of security in that the server will be viewed has having much MORE capacity -- as much as 10 times more -- than it actually possesses.