|
|
Summary
Service Level Agreements (SLAs) for Web 2.0/AJAX/Mobile applications often
are based on achievement of minimum performance levels for typical
user transactions.
End-User Perspective
What makes or breaks a complex web application is how well
it performs from the end user perspective.
There are multiple dimensions of this determination:
Application organization and ease-of-use issues are handled in the application design process, where in addition to structural issues attention must be paid to end-user performance.
Low-Level vs. High-Level Internet Measurements
Here is how Low-Level and High-Level tests compare:
Worldwide web performance affects low-level measurements greatly, but the variations in low-level performance are masked (averaged out) in high-level test playback times.
Web Performance Thresholding
Measurements that drive high-level end-user SLA compliance
usually involve multi-stage test playbacks that typically
run around 100 seconds or more.
Such a test playback is definative of correct operation of an application because in such a test there may be dozens or even hundreds of steps involved. Typically, there are several (often as many as a dozen) stopwatch checks along the way. In every stopwatch check the recorded data includes the time since the last "split" as well as the total time involved in the playback.
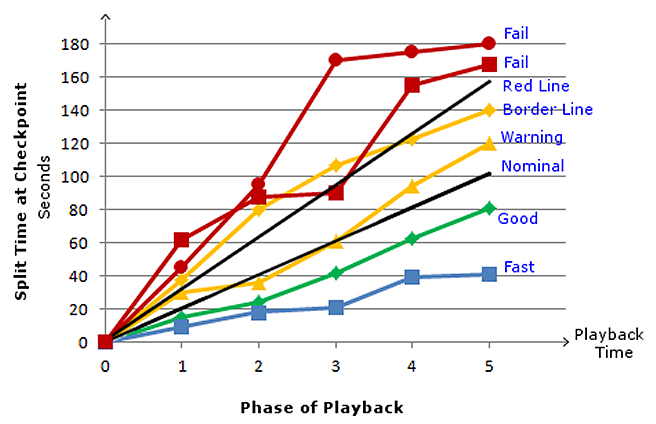
The chart illustrates how these user-level full-realism tests accumulate time as they move through stages of playback. For purposes of illustration there are 5 timer checks in the total script. Here is a summary:
For practical reasons SLA warnings should only occur when the end result of a long-playing script exceeds thresholds. In some cases, momentary excursions above the Nominal or Red Line should be noted, usually as some kind of WARNING message.
Scripting Measurement Scenario
eValid provides various methods to record intra-script timings.
Here is a typical report that shows times for regular monitoring of
a four-stage test sequence.
This kind of relative timing data can also be shown as suggested in the earlier chart. In either case the thresholds apply in the same way.