|
|
Introduction
The eValid dashboard provides a
common mode of control for the main modes of eValid operation.
It also provides dynamic status indications
of various activities within the eValid browser.
Operation
The optional eValid dashboard display
acts as a convenient auxiliary control panel for eValid.
Information shown in the eValid dashboard display is usually replicated in more-detailed displays generated by eValid subsystems (e.g. Site Analysis Summary or the Playback Summary).
The dashboard display changes based on the eValid operating mode. The information shown in the activity meter is switched automatically to be relevant to the activity being performed.
Display Availability
The eValid dashboard by default is shown when you launch eValid,
but you can change this by unselecting the "Display Dashboard on Startup" option.
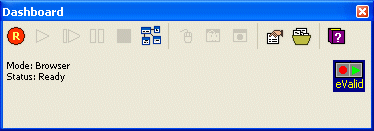
> > eValid Dashboard In Browser Mode
|
This is the dashboard display when eValid operates as a normal browser.
The information shown indicates activity and rates during browsing
operations.
From this dashboard display you can start a recording or start a site analysis or, if a script file is available, start playback. Available Icons: Record, Play, Site-Analysis, Preferences, Cache, Documentation |
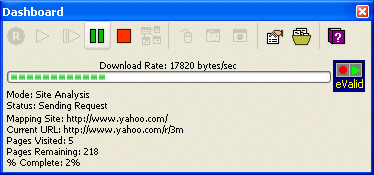
> > eValid Dashboard In Site Analysis Mode
|
This is the dashboard display when
eValid is performing a site analysis.
It shows the state of the analysis including showing whether
eValid is downloading, mapping, requesting a page, etc.
During a site analysis run the dashboard shows the URL being analyzed, the current URL being examined, the total number of pages visited so far, and the number of links remaining plus percentage completion, Available Icons: Site-Analysis, Start, Pause, Stop, Preferences, Cache, Documentation |
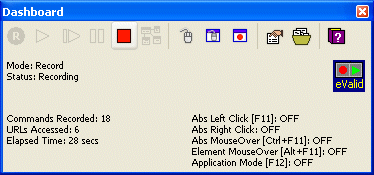
> > eValid Dashboard In Script Record Mode
|
This is the dashboard display when eValid is creating a test recording.
When you are in this mode the dashboard shows, for the current recording:
The status of major eValid recording modes is also shown with [notes on how to adjust the value]:
Available Icons: Record, Stop, F11, F12, Ctrl-F12, Preferences, Cache, Documentation |
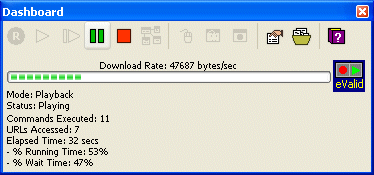
> > eValid Dashboard In Playback Script Mode
|
This is the dashboard display when
eValid is playing back a test recording.
In this mode the dashboard shows for the current script playback the number of commands executed, the number of URLs accessed, the elapsed playback time, and the percent of running time and wait time. Available Icons: Play (Resume), Single-Step, Pause, Stop, Preferences, Cache, Documentation |
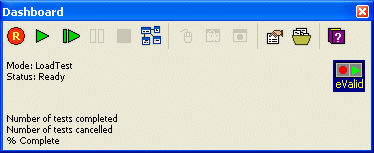
> > eValid Dashboard In LoadTest Mode
|
This is the dashboard display when
eValid is running a LoadTest scenario,
one composed of multiple copies of
the eValid browser playing back multiple scripts.
LoadTest scenarios are *evl files that contain at least
one _eValid instance.
In this mode the dashboard shows, relative to the current LoadTest script playback, the total number of tests completed, and the percentage of completion. Available Icons: Play, Single-Step, Pause, Stop, Preferences, Cache, Documentation |
Icon Definition Summary
Here is a summary of the eValid dashboard icons
that also shows
the equivalent function keys (when available).
Start Recording [F4] | Start Playback [F6] | Single-Step Playback [F7] | Pause Resume Playback [F8] | Stop Recording Playback LoadTest Site Analysis [F4] | Start Site Analysis [F3] |
Toggle Absolute MouseClicks [F11] | Toggle Application Mode [F12] | Activate Desktop Recording [Ctrl+F12] | View Preferences | Invoke Cache Manager [F2] | View Documentation |
Limitations
The dashboard is not available in BATCH modes
or for any eValid browsers launched by running a LoadTest playback.